This page contains information about the Lab 4 assignment.
Varying the gain value had a significant effect on the system response. These tests were run with the target (or setpoint) equal to 50 rad/s - about half the motor maximum speed. At low values of K, the controller didn't provide enough input to even move the motor. As K increased, the steady state speed began to approach the target speed, but overshoot also increased. Eventually, at K = 1.15, the controller caused the motor to fault due to over-current.
Clearly, some of the settling times are not accurate, thrown off by noise in the system. This noise means that, as far as MATLAB is concerned, the signal never settles. This was improved by setting the settling time threshold to 10% instead of 5%, but some are still off. One trend however is that settling time seems to increase with higher gain values. Higher gain values are also associated with lower error values. Unfortunately, for this system, gains high enough to keep error managable are also high enough to overload the motor driver. This is the disadvantage of a proportional-only controller.
To better visualize the progression, the responses for all K values are plotted on a single graph.
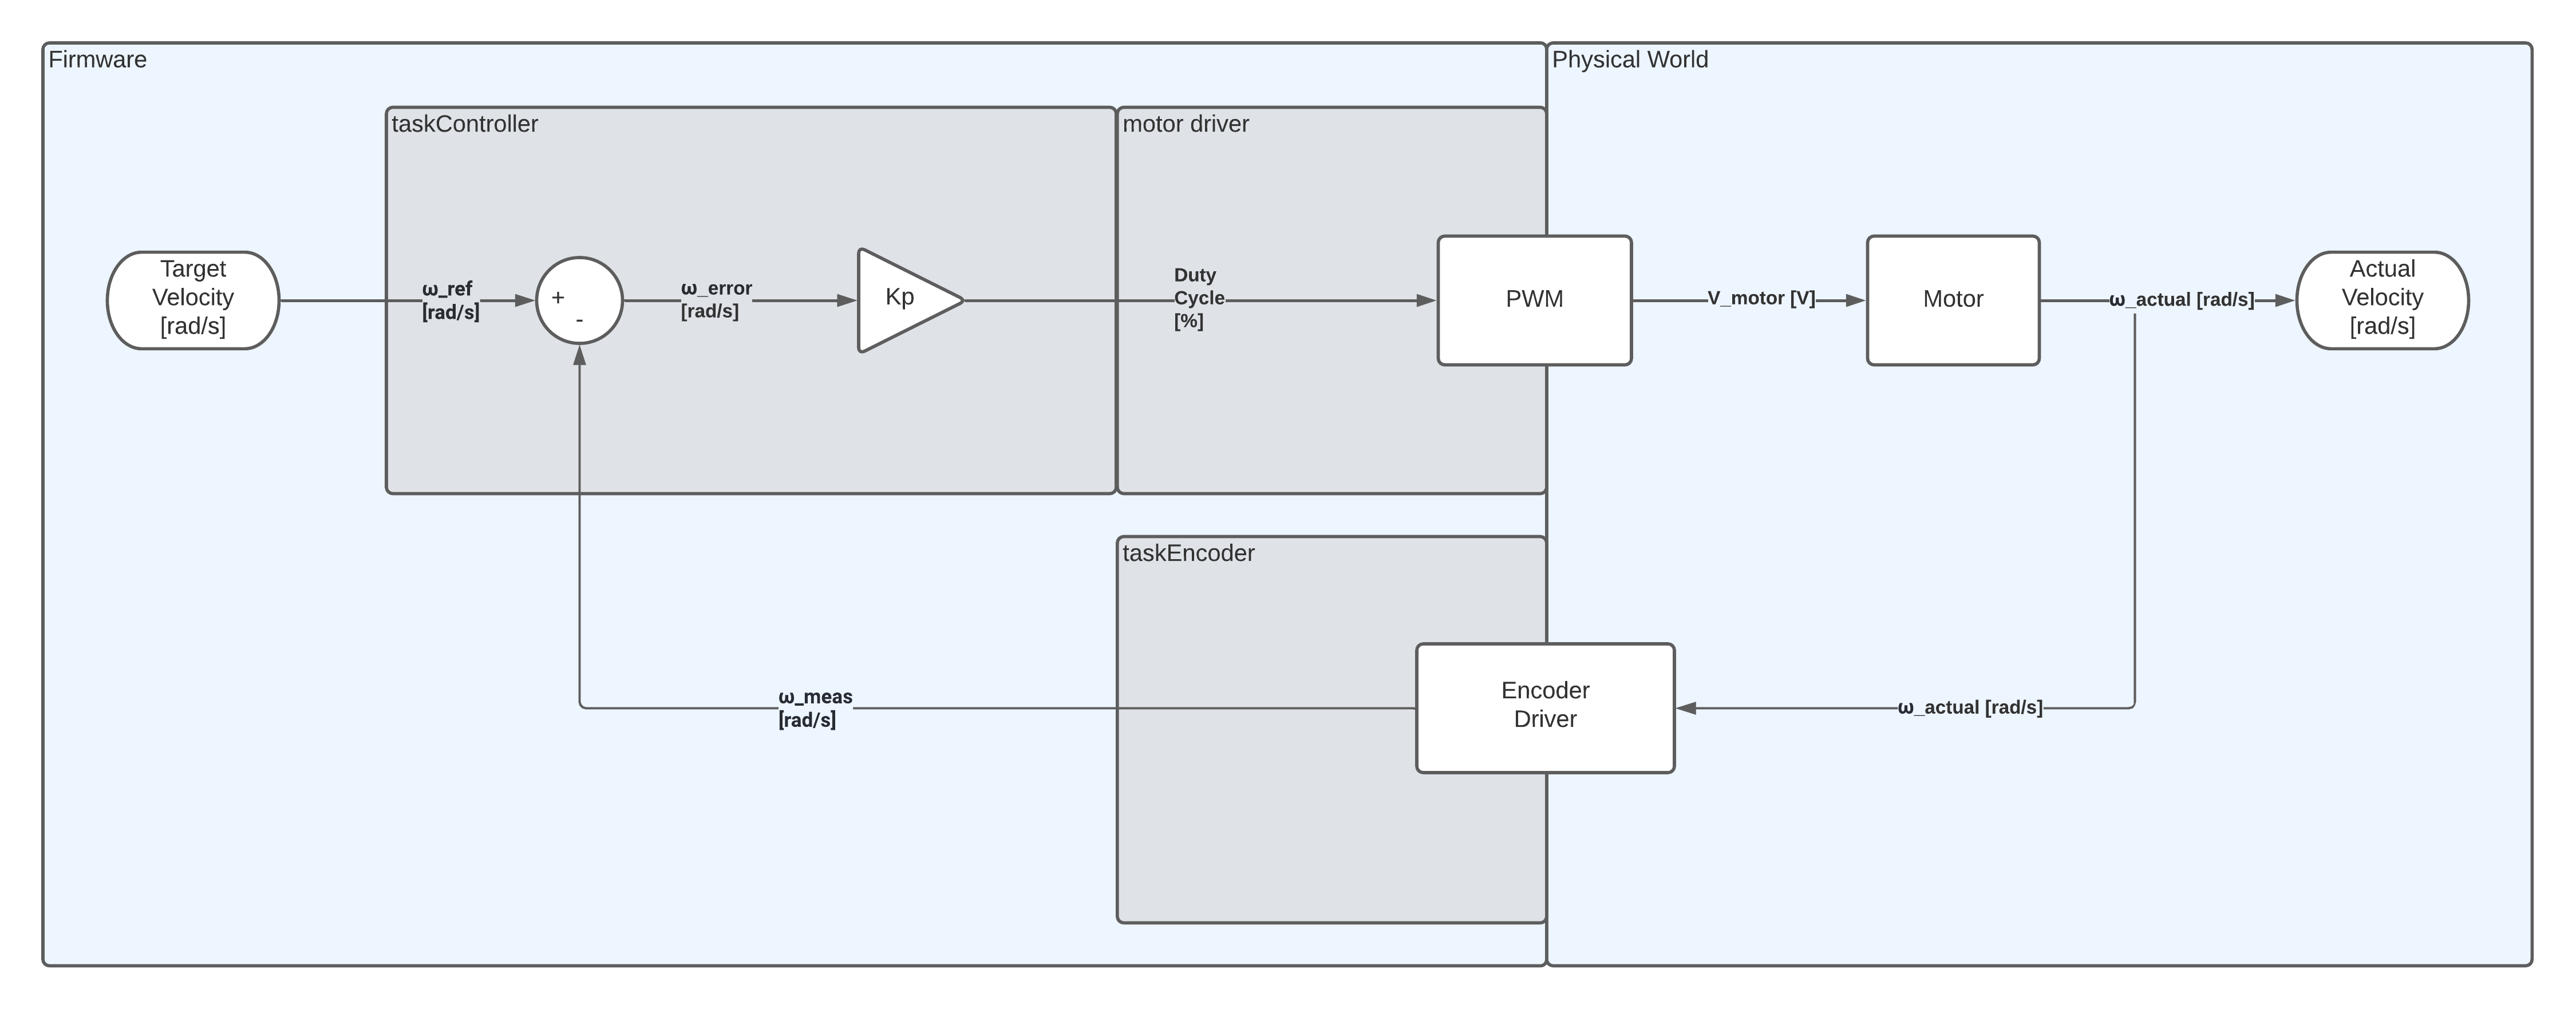
Here is a block diagram of the closed loop control system. Given a target velocity, the controller will use proportional control to try and achieve the signal.
